
What you see on the chart
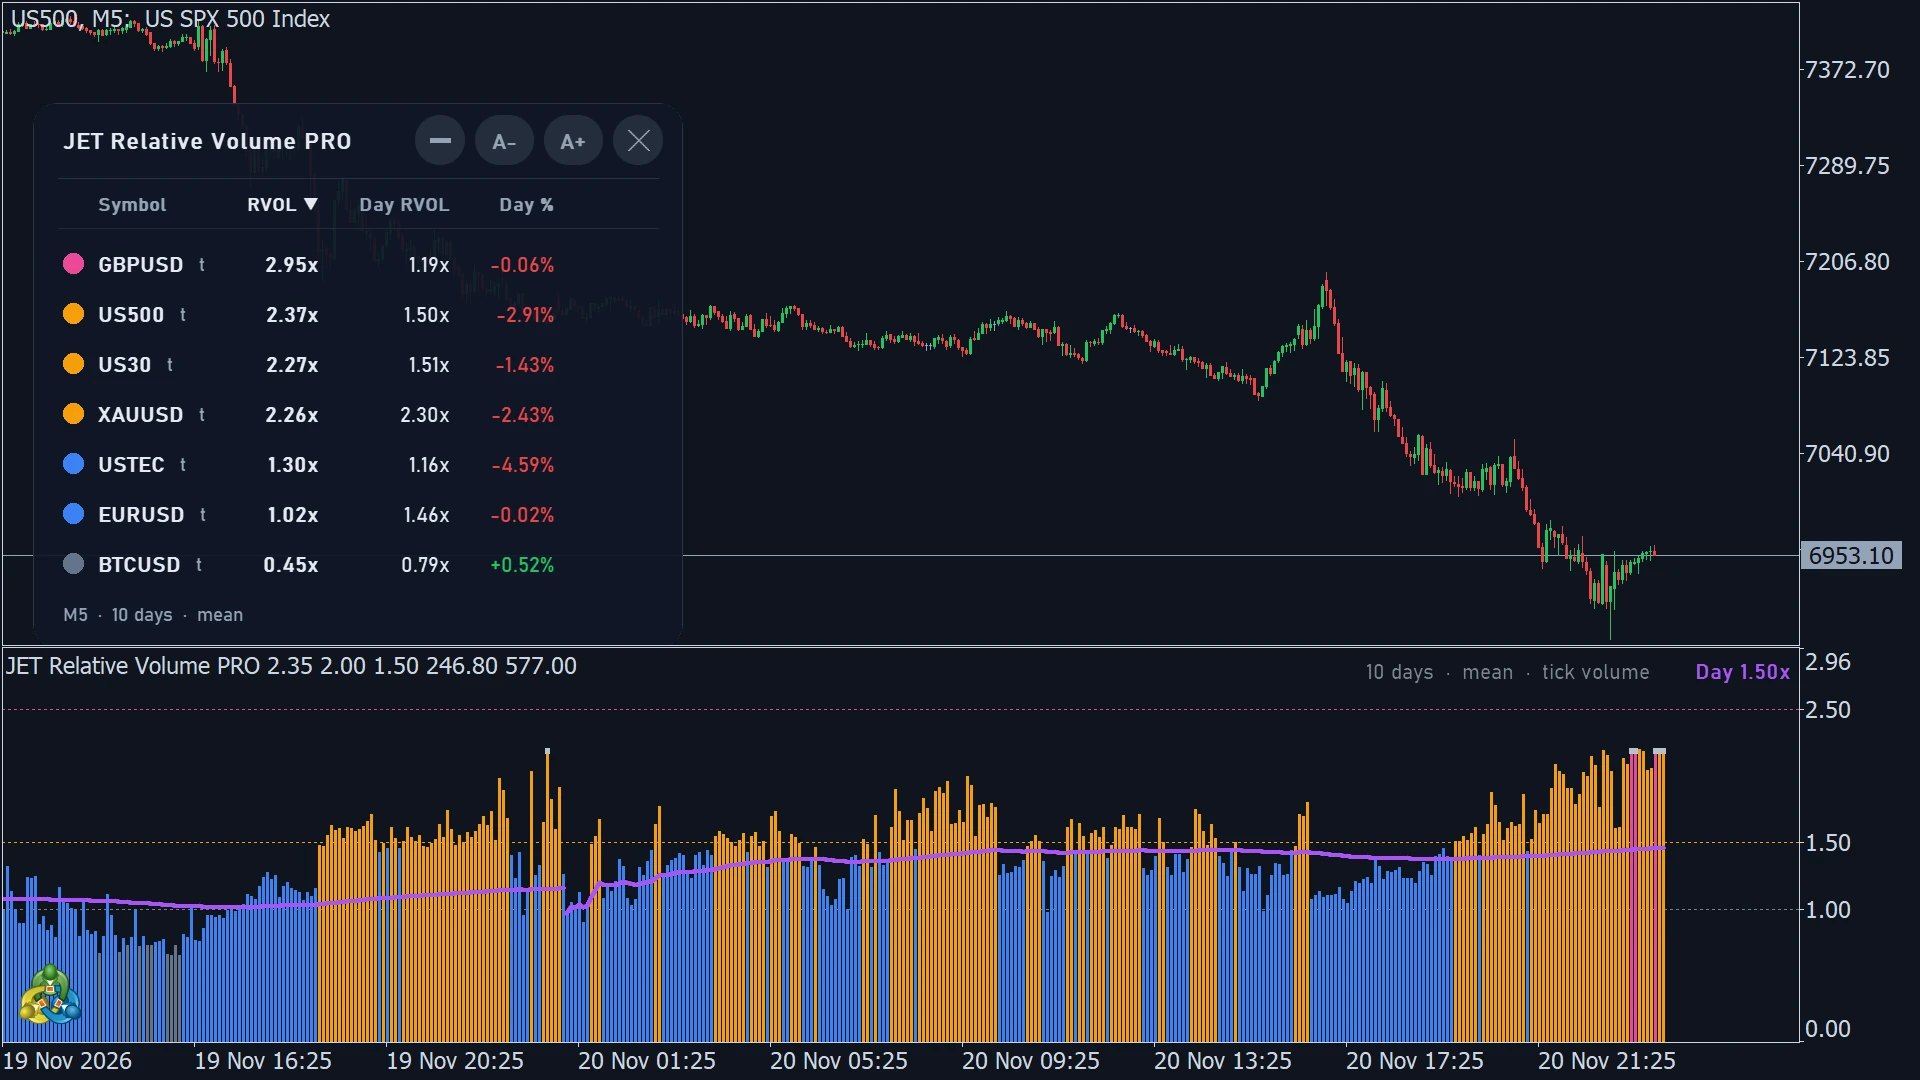
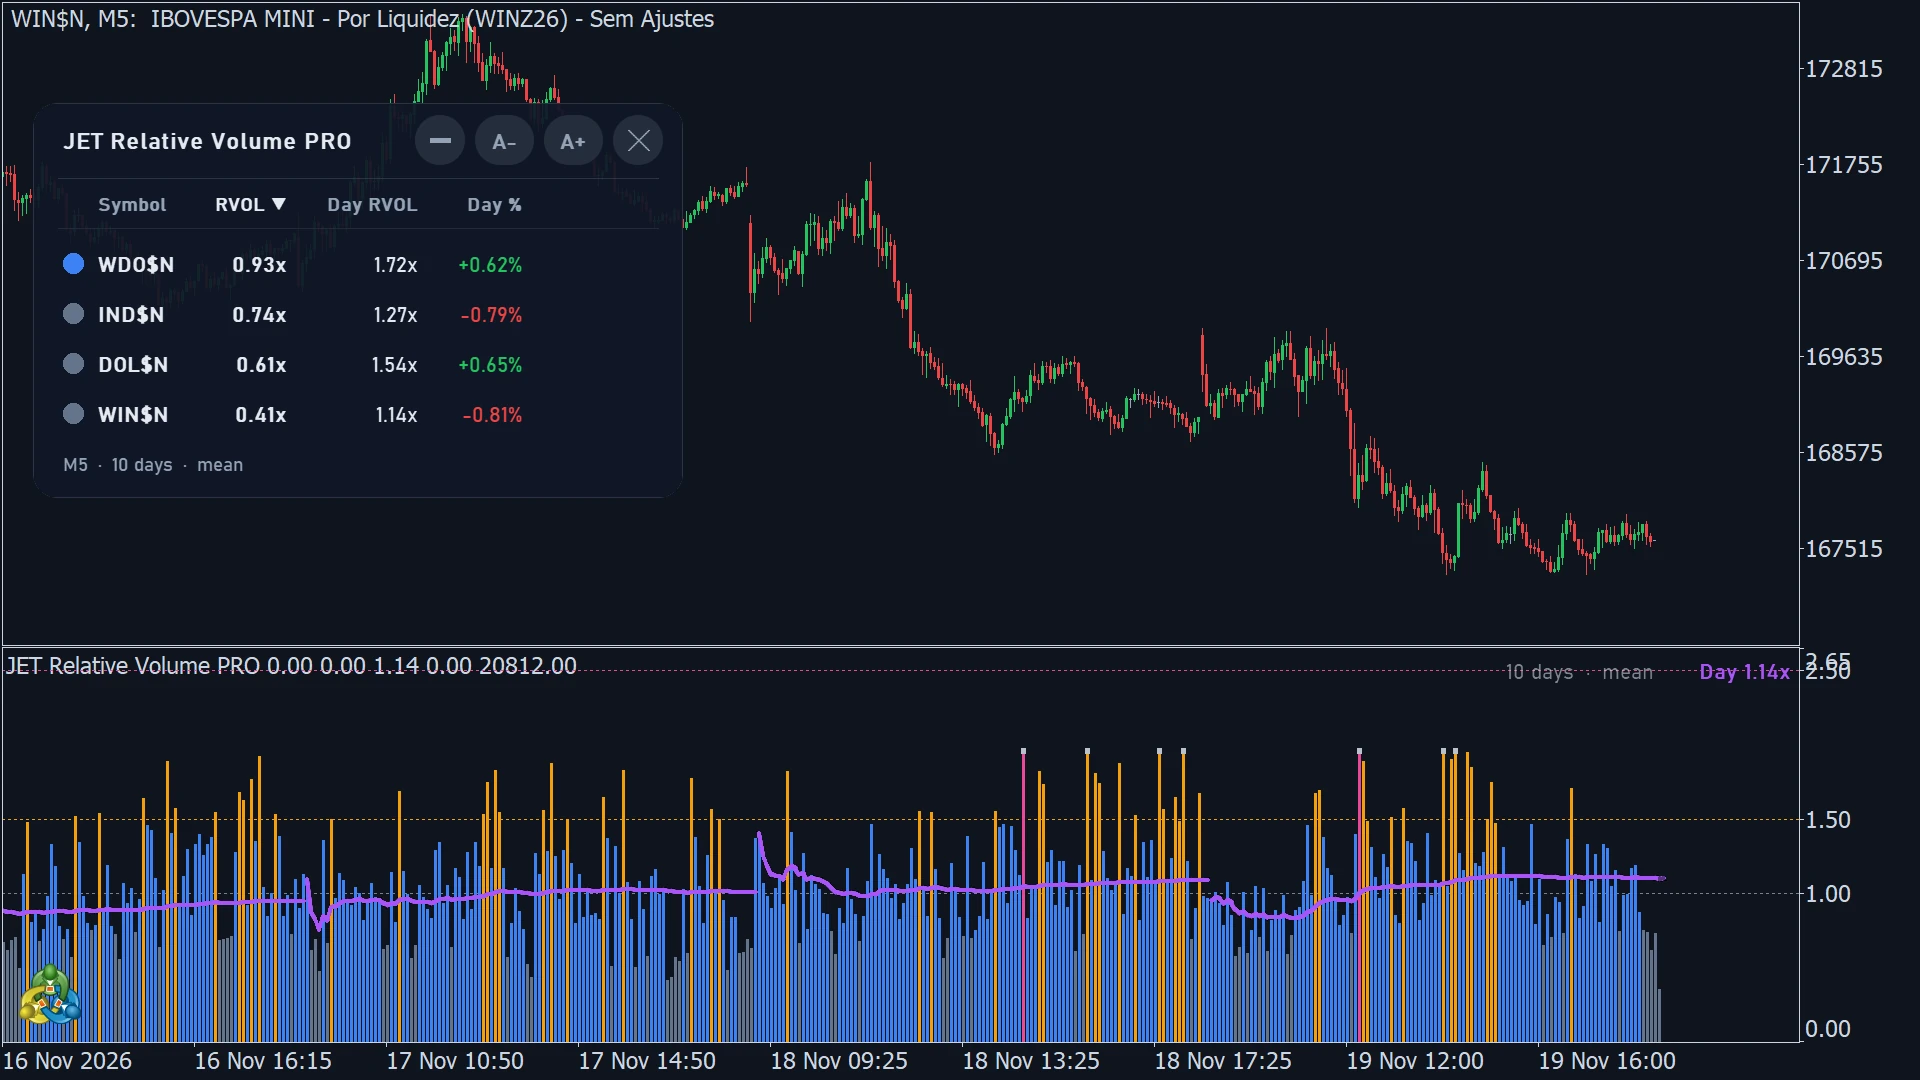
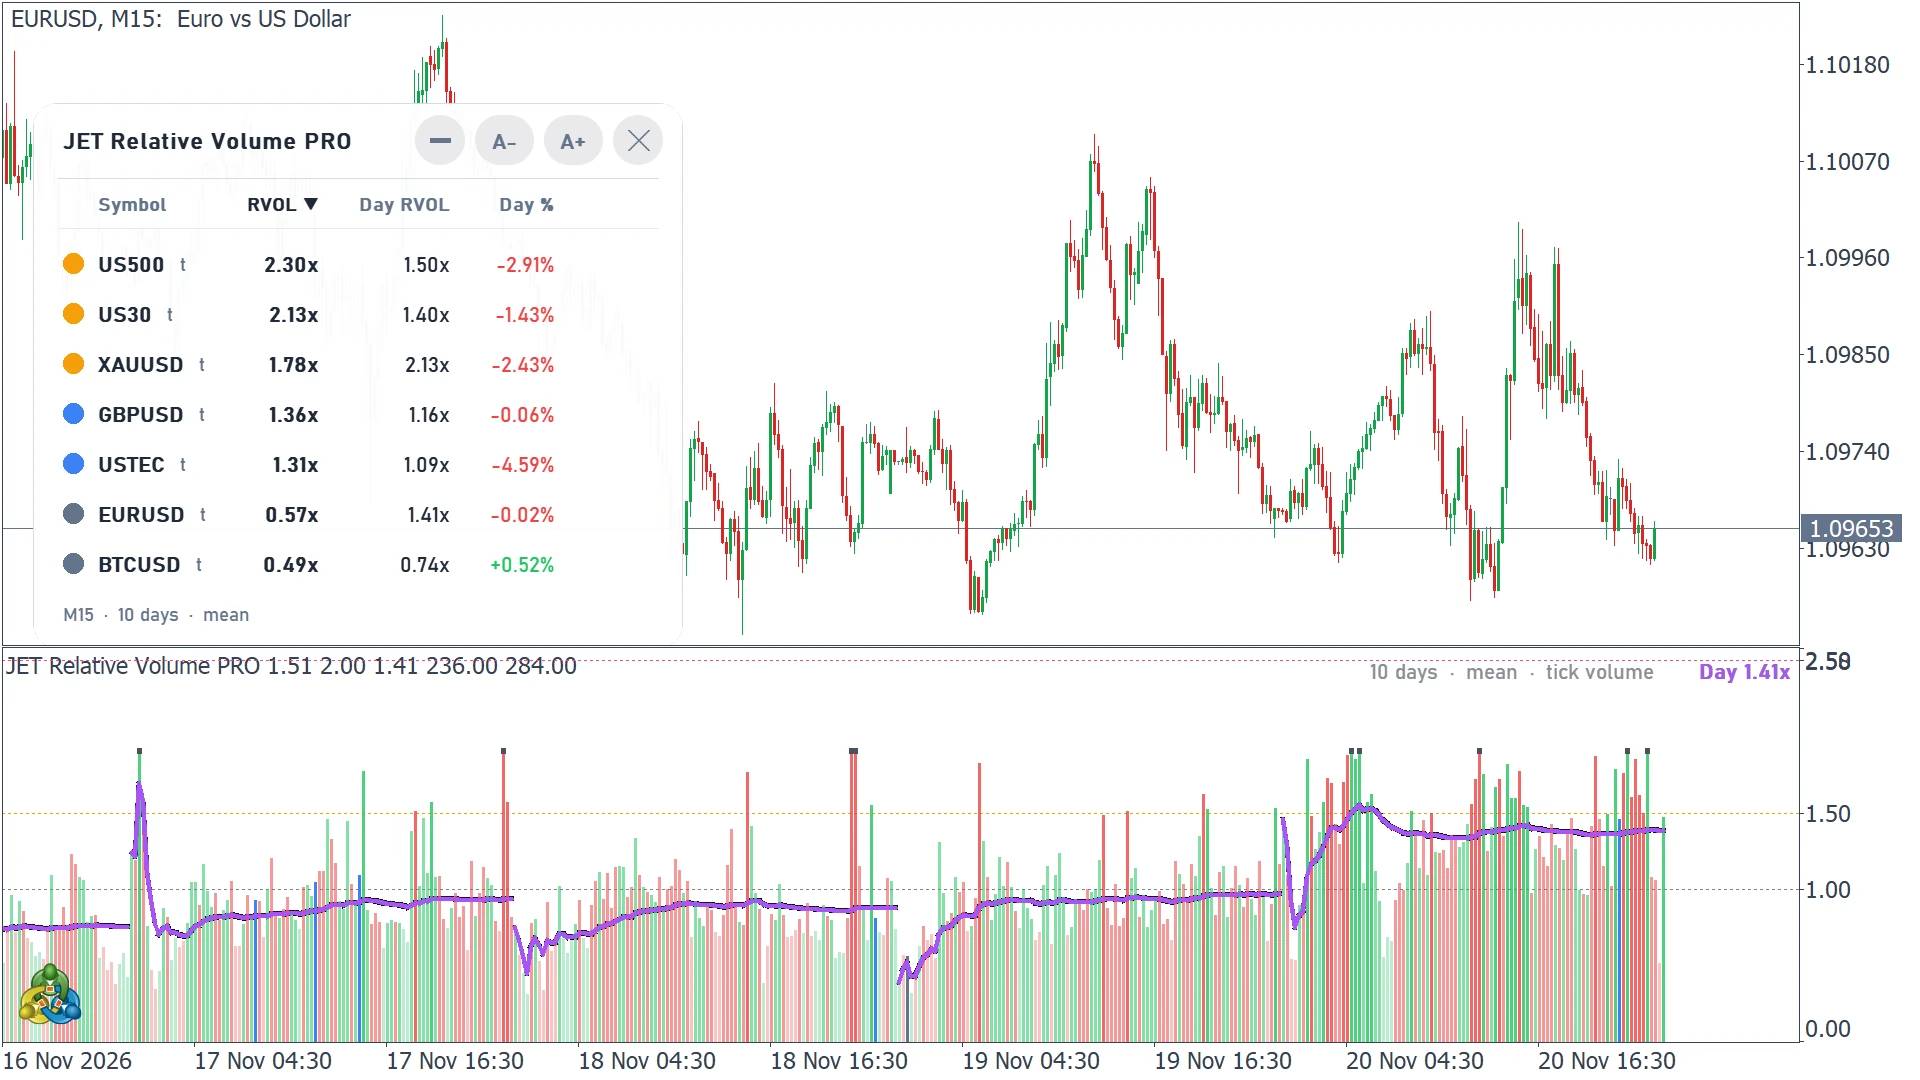
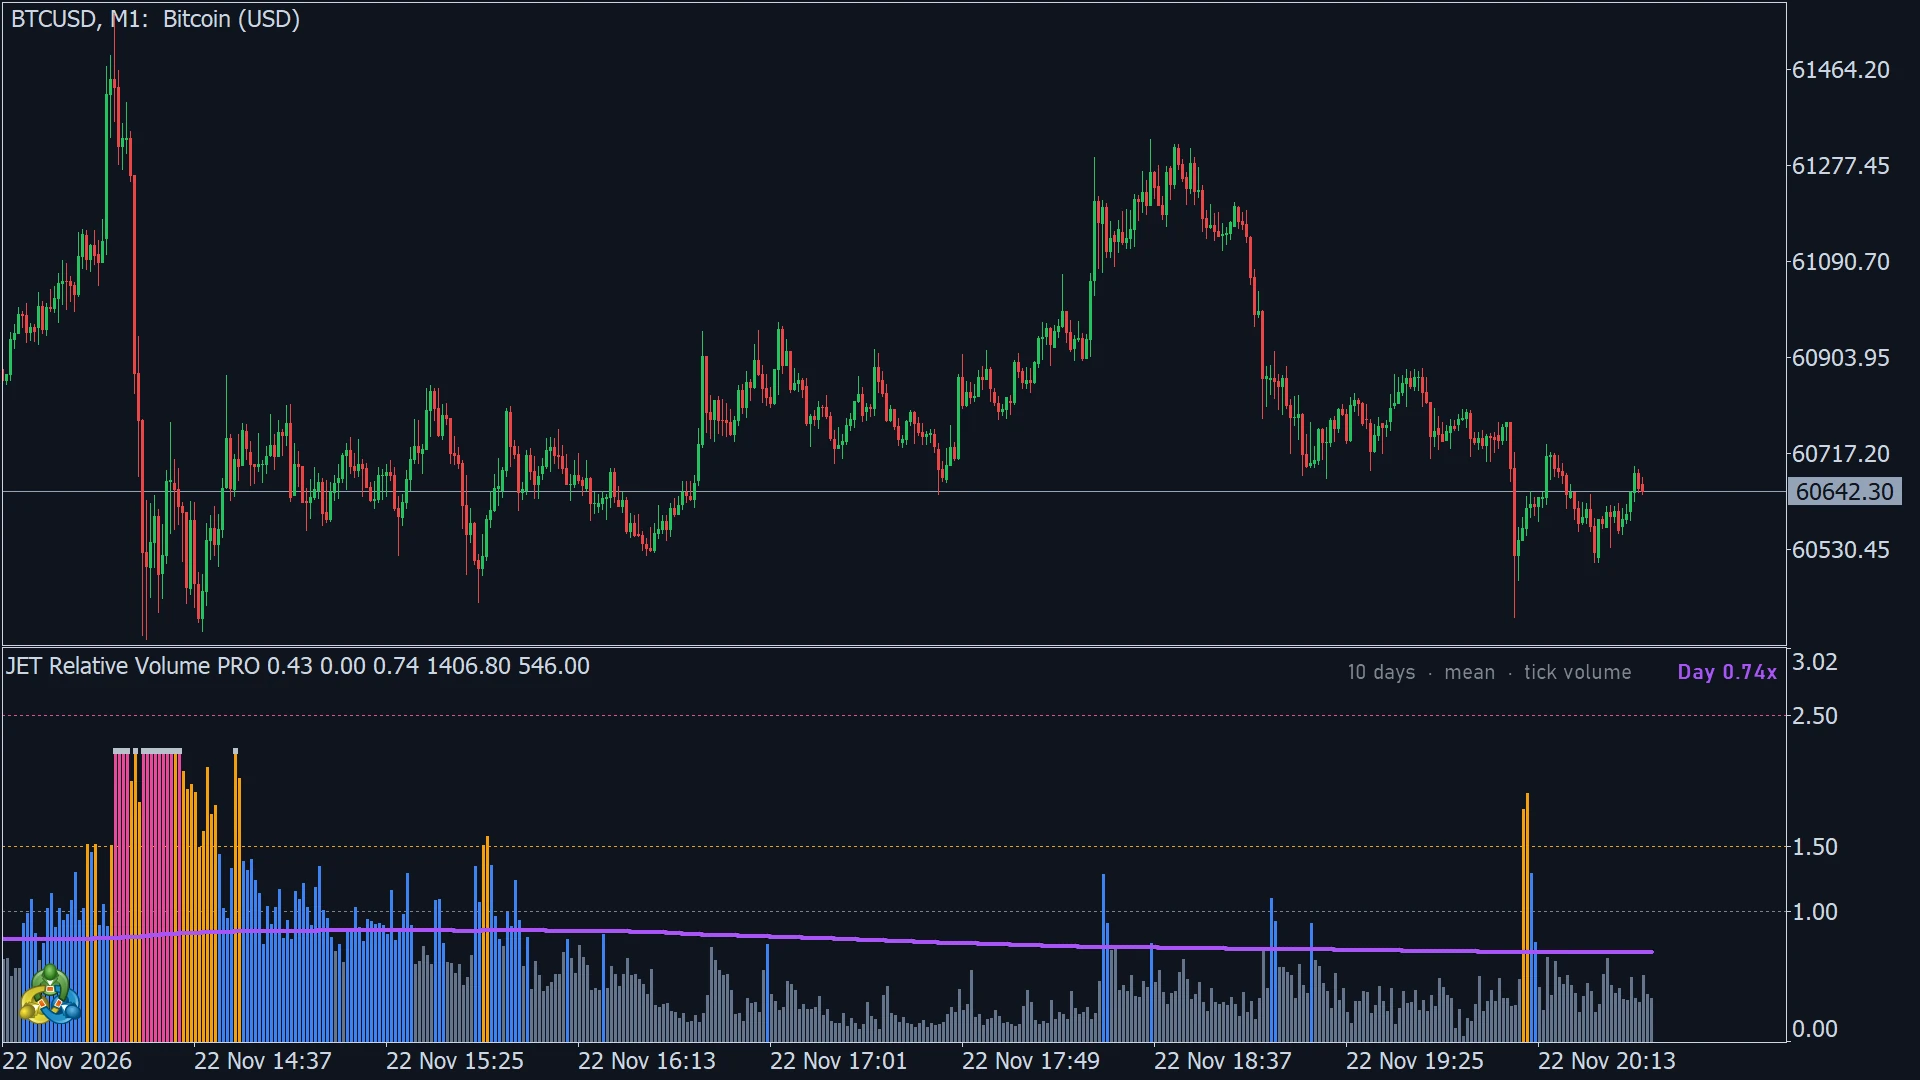
Histogram in a separate window colored by level: gray = low, blue = normal, amber = high, pink = extreme; limits and colors are editable.
Day cumulative line: the volume of the day so far compared with the usual volume up to the same time.
Closed bars never change; the bar in progress is provisional and can be projected by its elapsed time.
Panel with up to 12 symbols: RVOL of the last closed bar, day RVOL and day change, sortable, with a click to open a symbol.
Days to compare, mean or median, real or tick volume, and alignment by server time, exchange time or time since the day open.
Alerts on the closed bar (popup, sound, push or e-mail) and data for Experts (iCustom)
Requirements: MetaTrader 5, any symbol and timeframe. Real volume where the broker sends it (futures and stocks on B3, CME and other exchanges); forex, indices, metals and crypto use tick volume.
Version 1.00 · Updates are free and delivered through MetaTrader.
You may also like
 Volume Profile
JET TPO Profile PRO
TPO profiles session by session on the price chart: letters, POC, value area, initial balance, single prints, poor highs/lows, composite, alerts and data for Experts.
 Volume Profile
JET Weis Waves PRO
Weis waves on the price chart: volume, duration, distance and delta of every wave, compared with the last waves in the same direction, with alerts and data for Experts.
 Volume Profile
 Delta B3 PRO
Daily volume profiles split into real buy and sell aggression per price, live and in the Strategy Tester.